You can bring up the Histogram Window by doing any of:
Opening up the window from the main toolbar's
W
button.
By using
RMB->Window->Histogram.
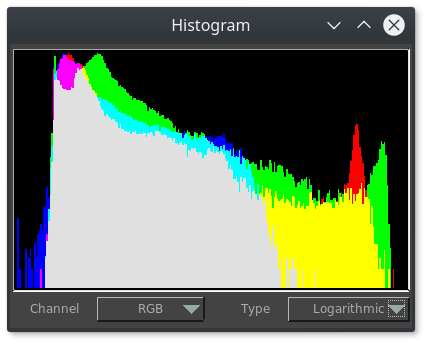
The Histogram Window allows you to see different types of histograms
for the current image or movie file.
A Histogram represents a chart mapping the occurrance of each color in
the image, going from black or darker colors on the left side, to white
or brighter colors on the right side.
Histograms are often used as a debugging aid to interpret color
information in an image and can easily pinpoint problems in contrast in
an image.
In the example image above, you can see for example that in the blue
channel, black or close to black appears often in the image, which may
or may not be what you want (depending on the image).
Using the
Channel
popup menu, you can choose to display only one of the channels, for easier visualization.
A histogram can be shown using a linear, logarithmic or square root
counter. You can change this display from the
Type
popup menu.
A linear histogram shows a proportianal line for each color count in an
image. On images where some color like black appears too
often,
it may result in a big spike while all other colors remain flat.
A logarithmic or square root histogram takes that same count and
applies a log or square root operation which makes the chart a little
bit flatter and often nicer to interpret.
The default histogram type is a logarithmic histogram.